Postmortem profiling

When it's not possible to run an application from the IDE, but it's possible to re-compile application, run it on a target and transfer results back to host machine, you can use the results of postmortem profiling to transfer the results using the Import wizard.
To profile the application, follow these steps:
  1. Enable binary instrumentation for profiling (see Building a program for profiling).
  2. Recompile the application and transfer the binary to a target machine. Next, create a profiler session by importing profiler data. Ensure that you compile the binary with instrumentation enabled.
  3. Run the instrumented binary on the target with data collection enabled.
  4. Transfer the output file to the host machine.
  5. Open the Application Profiler perspective.
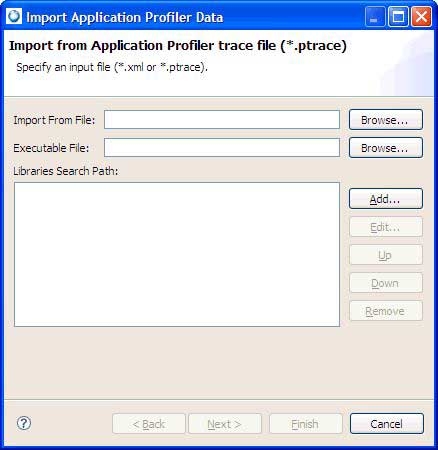
  6. In the Profiler Sessions view, click the Import Application Profiler Session icon to import the data:

    Icon: Importing an Application Profiler session

    The Application Profiler Import wizard opens.

    Importing Application Profiler data

  7. Select a file to import, and then click Next.
  8. Select the name of a session that you want to import.
  9. Click Finish. The IDE creates a new Application Profiler session and populates it with the imported data, as well as populating the Execution Time view with data.
The Application Profiling session is ready to use.
Related concepts
Using Function Instrumentation with the Application Profiler
Using Sampling and Call Count instrumentation mode
Using Function Instrumentation mode for a single application
Using Function Instrumentation in the System Profiler
Comparing profiles
Related tasks
Creating an Application Profiler session
Creating a profiler session by importing profiler data
Profiling a single-threaded application
Profiling a running process for an existing project
Using postmortem profiling for Call Count and Sampling
Running an instrumented binary with profiling from a command prompt (Function Instrumentation mode)
Taking a snapshot of a profiling session