The Session view lets you manage your memory analysis sessions, which keep historical data. Session elements allow you to quickly filter data by this element, for example by file or by tid. Double-clicking on a session opens the Memory Analysis editor for this session.
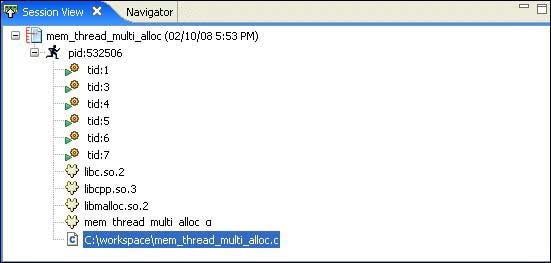
The view lists all of the memory analysis sessions that you've created in your workspace while running programs with the Memory Analysis tool active. Each session is identified by a name, date stamp, and an icon that indicates its current state.
The icons indicate:
-
![[Connected]](../images/ic2Fmemory_session_view_info.xml_d133296e54.jpg)
- This memory analysis session is open and can be viewed in the Memory Analysis editor.
-
![[Disconnected]](../images/ic2Fmemory_session_view_info.xml_d133296e69.jpg)
- This session is closed and cannot currently be viewed.
-
![[Running]](../images/ic2Fmemory_session_view_info.xml_d133296e84.jpg)
- This session is still running on the target; you can select the session and view its incoming traces. You also can change settings dynamically and run leak detection or dump memory usage statistics from IDE.
-
![[Indexing]](../images/ic2Fmemory_session_view_info.xml_d133296e99.jpg)
- The traces and events are being indexed. This icon appears only if you stop the memory analysis session or your process terminates. If your process terminates, the running icon may still be shown while the database is registering the events and traces; when this is done, the indexing icon appears. Wait until indexing is finished, or the information might be incomplete.
Right-clicking on an open session (![[Connected]](../images/ic2Fmemory_session_view_info.xml_d133296e114.jpg) ) shows a menu with several options:
) shows a menu with several options:
) shows a menu with several options: - View
- Close
- Delete
- Rename...
- Properties...
- Import...
- Export...
Right-clicking on a closed session (![[Disconnected]](../images/ic2Fmemory_session_view_info.xml_d133296e147.jpg) ) shows a menu with several options:
) shows a menu with several options:
) shows a menu with several options: - Open
- Delete
- Rename...
- Properties...
- Import...
- Export...