Connecting the Abatron BDI2000 Debugger to your target

After you upload the firmware to the BDI200 module (previously, you used a serial line communication, which is used only for the initial configuration of the BDI2000 Debugger system), the host is then connected to the BDI20000 through the serial interface (using one of COM1 through COM4).

The following illustration shows how the Abatron BDI2000 JTAG Debugger is connected between the host and the target for debugging purposes:

Architecture for connecting the Abatron BDI2000 Debugger to your target
                    machine

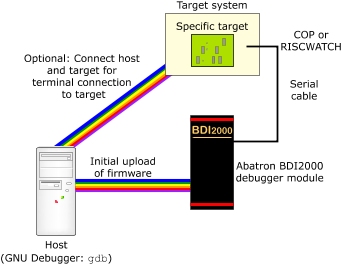
Architecture for connecting the Abatron BDI2000 Debugger to your target machine.

To physically connect the Abatron BDI2000 to your target board:
  1. Unplug the Abatron BDI2000 Debugger module, because it should be powered off before you connect it to the target board. Remove the serial cable from the BDI2000 and your host machine; you need it only for the firmware update.
  2. At this point, you can connect a serial cable to your target board.
  3. Connect one end of the JTAG debugger cable into the BDI2000, and the other into the JTAG port of your target machine. The JTAG port may also be labeled COP or RISCWATCH, depending on the hardware.
  4. Run the tftpsrv.exe file in the BDI setup directory prior to plugging the BDI2000 back in. The TFTP server is responsible for passing the register definition files (.def) to the BDI2000 every time it powers on.
  5. Plug the BDI2000 back in.
  6. Open a terminal window and type telnet BDI_IP_ADDRESS, where BDI_IP_ADDRESS is the IP address assigned to the device during the previous step. You should be greeted with a listing of all the possible monitor commands.
  7. If you chose to connect a serial board to your target hardware previously, you can now open a console connection to your hardware and type reset run into the telnet session with the BDI2000 Debugger. You should see your target board booting up on the console.