The Debug view lets you manage the debugging or running of a program in the workbench. This view shows the stack frame for the suspended threads for each target you're debugging. Each thread in your program appears as a node in the tree. The view shows the process for each program you're running:
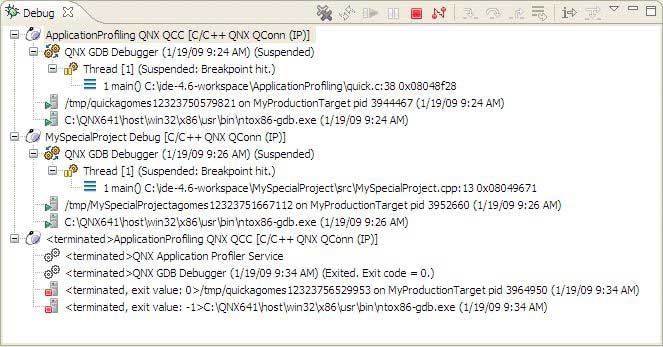
The Debug view shows the stack frame for the suspended threads.
The number that appears after a thread label is a reference counter, not a thread identification number (TID).
The IDE shows stack frames as child elements, and it includes the reason for the suspension beside the thread, (for example, the end of the stepping range was reached, a breakpoint was encountered, or a signal was received). When a program exits, the IDE also shows the exit code.
The Debug view shows the launch, debugger, and thread instance, as well as the stack frame, application, and controls for each target you're debugging.
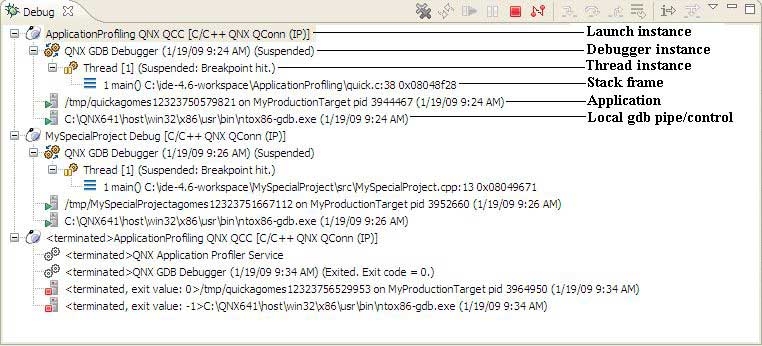
Overview of the Debug view.
The label includes the thread's state. In the example above, the thread was suspended because the program hit a breakpoint. You can't suspend only one thread in a process; suspension affects all threads.
The Debug view also drives the C/C++ editor; as you step through your program, the C/C++ editor highlights the location of the execution pointer.