![[Previous]](prev.gif) |
![[Contents]](contents.gif) |
![[Index]](keyword_index.gif) |
![[Next]](next.gif) |
![[Previous]](prev.gif) |
![[Contents]](contents.gif) |
![[Index]](keyword_index.gif) |
![[Next]](next.gif) |
 |
This version of this document is no longer maintained. For the latest documentation, see http://www.qnx.com/developers/docs. |

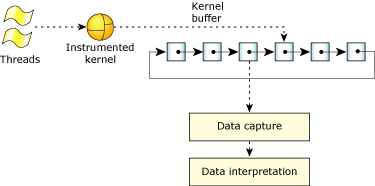
Overall view of the SAT.
Once the data has been captured, you may process it, either in real time or offline.

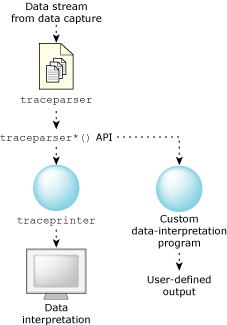
Possible data interpretation configurations.
The traceparser library provides a front end to facilitate the handling and parsing of events received from the Instrumented Kernel and the data-capture utility. The library serves as a thin middle layer to:
A simple event is an event that can be described in a single event buffer slot; a combine event is an event that is larger and can be fully described only in multiple event buffer slots. Both simple and combine events consist of only one kernel event.
Each event buffer slot is an opaque traceevent_t structure.
 |
The traceevent_t structure is opaque—although some details are provided, the structure shouldn't be accessed without the libtraceparser API. |
The traceevent_t structure is only 16 bytes long, and only half of that describes the event. This small size reduces instrumentation overhead and improves granularity. Where the information required to represent the event won't fit into a single traceevent_t structure, it spans as many traceevent_t structures as required, resulting in a combine event. A combine event isn't actually several events combined, but rather a single, long event requiring a combination of traceevent_t elements to represent it.
In order to distinguish regular events from combine events, the traceevent_t structure includes a 2-bit flag that indicates whether the event is a single event or whether it's the first, middle, or last traceevent_t structure of the event. The flag is also used as a rudimentary integrity check. The timestamp element of the combine event is identical in each buffer slot; no other event will have the same timestamp.
Adding this “thin” protocol doesn't burden the Instrumented Kernel and keeps the traceevent_t structure small. The trade-off, though, is that it may take many traceevent_t structures to represent a single kernel event.
Although events are timestamped immediately, they may not be written to the buffer in one single operation (atomically). When multiple buffer slot events (“combine events”) are being written to the buffer, the process is frequently interrupted in order to allow other threads and processes to run. Events triggered by higher-priority threads are often written to the buffer first. Thus, events may be interlaced. Although events may not be contiguous, they are not scrambled (unless there's a buffer overrun.) The sequential order of the combine event is always correct, even if it's interrupted with a different event.
In order to maintain speed during runtime, the Instrumented Kernel writes events unsorted as quickly as possible; reassembling the combine events must be done in post-processing. The libtraceparser API transparently reassembles the events.
The timestamp is the 32 Least Significant Bits (LSB) part of the 64-bit clock. Whenever the 32-bit portion of the clock rolls over, a control event is issued. Although adjacent events will never have the same exact timestamp, there may be some timestamp duplication due to the clock's rolling over.
The rollover control event includes the 32 Most Significant Bits (MSB), so you may reassemble the full clock time, if required. The timestamp includes only the LSB in order to reduce the amount of data being generated. (A 1 GHz clock rolls over every 4.29 sec—an eternity compared to the number of events generated.)
 |
Although the majority of events are stored chronologically, you shouldn't write code that depends on events being retrieved chronologically. Some multiple buffer slot events (combine events) may be interlaced with others with leading timestamps. In the case of buffer overruns, the timestamps will definitely be scrambled, with entire blocks of events out of chronological order. Spurious gaps, while theoretically possible, are very unlikely. |
The traceprinter utility consists of a long list of callback definitions, followed by a fairly simple parsing procedure. Each of the callback definitions is for printing.
In its native form, the traceprinter utility is of limited use. However, it's been designed to be easily borrowed from, copied, or modified to allow you to customize your own utilities. See the copyright header included in the source for the full terms of use.
For functionality details, see traceprinter in the Neutrino Utilities Reference.
![[Previous]](prev.gif) |
![[Contents]](contents.gif) |
![[Index]](keyword_index.gif) |
![[Next]](next.gif) |