![[Previous]](prev.gif) |
![[Contents]](contents.gif) |
![[Index]](keyword_index.gif) |
![[Next]](next.gif) |
|
|
|
|
 |
This version of this document is no longer maintained. For the latest documentation, see http://www.qnx.com/developers/docs. |
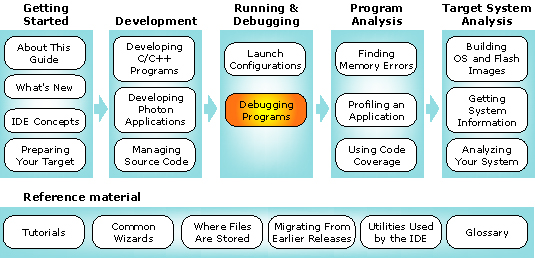
You can select a topic from this diagram:
This chapter shows you how to work with the debugger.
In this chapter:
One of the most frequently used tools in the traditional design-develop-debug cycle is the source-level debugger. In the IDE, this powerful tool provides an intuitive debugging environment that's completely integrated with the other workbench tools, giving you the flexibility you need to best address the problems at hand.
Have you ever had to debug several programs simultaneously? Did you have to use separate tools when the programs were written in different languages or for different processors? The IDE's source debugger provides a unified environment for multiprocess and multithreaded debugging of programs written in C, C++, Embedded C++, or Java. You can debug such programs concurrently on one or multiple remote target systems, or locally if you're doing Neutrino self-hosted development.
In order to use the full power of the Debug perspective, you must use executables compiled for debugging. These executables contain additional debug information that lets the debugger make direct associations between the source code and the binaries generated from that original source. In the IDE, you'll see different icons: a running man for executables that weren't compiled for debugging, or a bug for those that were.
The IDE debugger uses GDB as the underlying debug engine. It translates each GUI action into a sequence of GDB commands, and then processes the output from GDB to display the current state of the program being debugged.
The IDE updates the views in the Debug perspective only when the program is suspended.
 |
Editing your source after compiling causes the line numbering to be out of step because the debug information is tied directly to the source. Similarly, debugging an optimized binary can also cause unexpected jumps in the execution trace. |
Although you can debug a regular executable, you'll get much more information and control by building debug variants of the executables. To build an executable with debugging information, you must pass the -g option to the compiler. If you're using a QNX Make project, the filename for the debug variant has _g appended to it.
To specify the -g option from the project options:
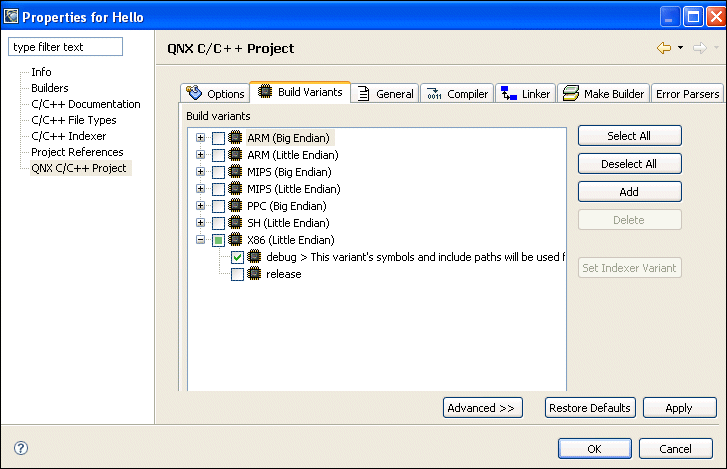
For more information about setting project options, see the Common Wizards Reference chapter.
|
For a full description of starting your programs and the launch configuration options, see the Launch Configurations Reference chapter. |
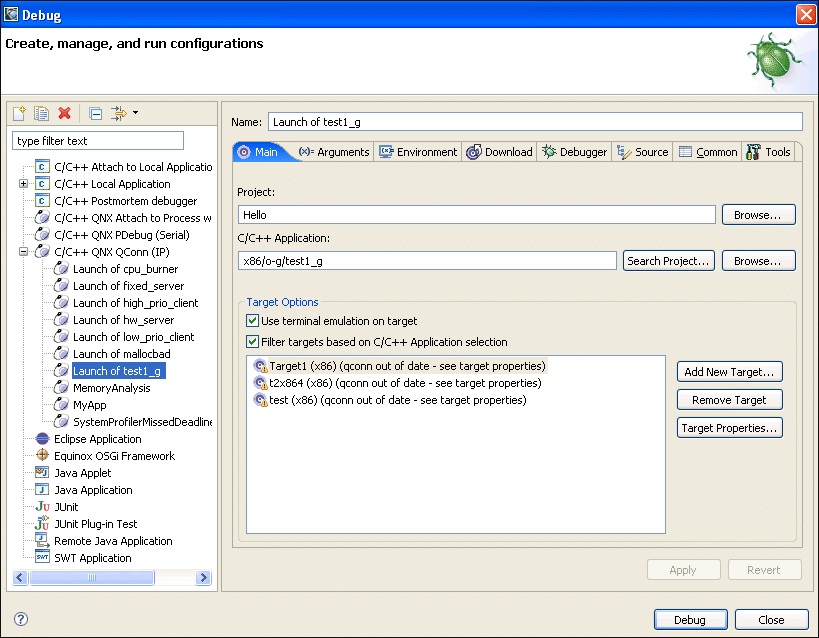
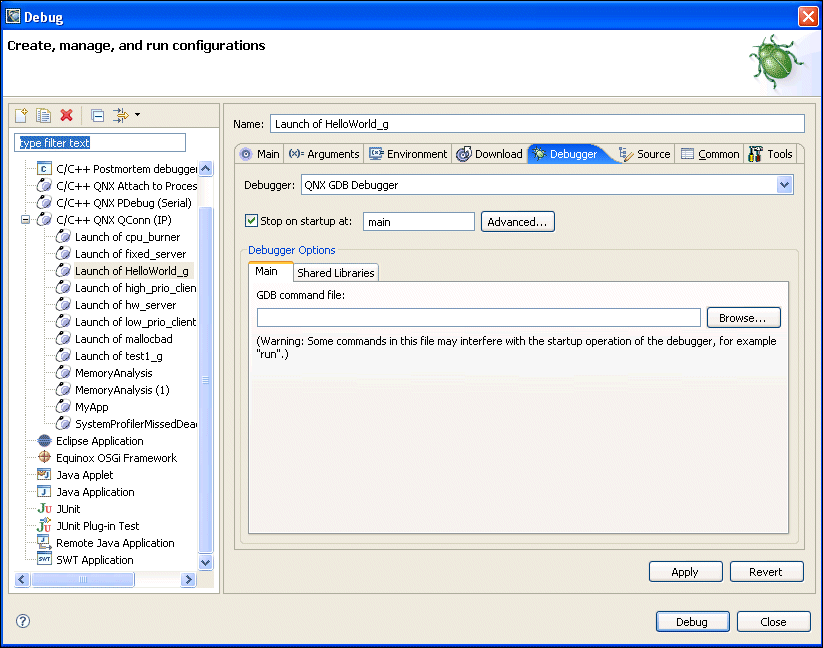
After building a debug-enabled executable, your next step is to create a launch configuration for that executable so you can run and debug it:
|
For Neutrino, if you want to perform a local debug of your project, you can't use the default QNX GDB debugger option. Instead, select GDB Debugger from the Debugger list. |
If launching a debugging session doesn't work when connected to the target with qconn, ensure that pdebug is on the target, and it is located in one of the directories in the PATH that qconn uses (typically /usr/bin).
|
By default:
|
|
The contents of all views in the Debug perspective are driven by the selections you make in the Debug view. |
The Debug view lets you manage the debugging or running of a program in the workbench. This view displays the stack frame for the suspended threads for each target you're debugging. Each thread in your program appears as a node in the tree. The view displays the process for each program you're running:
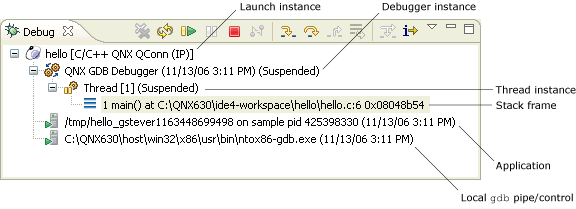
The Debug view shows the target information in a tree hierarchy as follows (shown here with a sample of the possible icons):
| Session item | Description | Possible icons |
|---|---|---|
| Launch instance | Launch configuration name and type (e.g. Stack Builder [C/C++ QNX QConn (IP)]) | |
| Debugger instance | Debugger name and state (e.g. QNX GDB Debugger (Breakpoint hit)) | |
| Thread instance | Thread number and state (e.g. Thread[1] (Suspended)) | |
| Stack frame instance | Stack frame number, function, filename, and line number |
|
The number beside the thread label is a reference counter for the IDE, not a thread ID (TID) number. |
The IDE displays stack frames as child elements, and gives the reason for the suspension (e.g. end of stepping range, breakpoint hit, signal received, and so on). When a program exits, the IDE displays the exit code.
The label includes the thread's state. In the example above, the thread was suspended because the program hit a breakpoint. You can't suspend only one thread in a process; suspension affects all threads.
The Debug view also drives the C/C++ editor; as you step through your program, the C/C++ editor highlights the location of the execution pointer.
After you start the debugger, it stops (by default) in main() and waits for your input. (For information about changing this setting, see the "Debugger tab" section in the Launch Configurations Reference chapter.)
The debugging controls appear in the following places (but not all together in any one place):
The controls are superseded by breakpoints. For example, if you ask the program to step over a function (i.e. run until it finishes that function) and the program hits a breakpoint, the program pauses on that breakpoint, even though it hasn't finished the function.
The icons and menu items are context-sensitive. For example, you can use the Terminate action to kill a process, but not a stack frame.
| Action | Icon | Hotkey | Description |
|---|---|---|---|
| Resume | F8 | Run the process freely from the current point. | |
| Suspend | Regain control of the running process. | ||
| Terminate | Kill the process. | ||
| Restart | Rerun the process from the beginning. | ||
| Resume without signal | Resume the execution of a process without delivering any pending signals. | ||
| Step Into | F5 | Step forward one line, going into function calls. | |
| Step Over | F6 | Step forward one line without going into function calls. | |
| Run to return | F7 | Finish this function. | |
| Resume at line | Resume the execution of the process at the specified line. Using this action to change into a different function may cause unpredictable results. | ||
| Toggle Instruction Stepping | Toggle what all the operators work on (machine instructions or source code). |
You can control your debug session in various ways:
You'll probably use the Debug view primarily to control your program flow.
To control your debug execution:
Even if you're running your debug session without the Debug view showing, you can use the hotkeys (or the Run menu) to step through your program. You can enable the debug hotkeys in any perspective.
To see a list of the currently active hotkeys, press Ctrl-Shift-L or choose . To customize the debug hotkeys:
You can control your debug session using the C/C++ editor by having the program run until it hits the line your cursor is sitting on. If the program never hits that line, the program runs until it finishes or hits another breakpoint.
You can also use the C/C++ editor's context menu to resume execution at a specific line, or to add a watch expression.
To use the C/C++ editor to debug a program:
|
Note that Run To Line works only in the current stack frame. That is, you can use Run to Line within the currently executing function. |
In addition to controlling the individual stepping of your programs, you can also control the debug session itself (e.g. terminate the session, stop the program, and so on) using the debug launch controls available in the Debug view (or in the view's right-click menu).
As with the other debug controls, these are context-sensitive; some are disabled depending on whether you've selected a thread, a process, and so on, in the Debug view.
| Action | Icon | Description |
|---|---|---|
| Terminate | Kill the selected process. | |
| Terminate & Remove | Kill the selected process and remove it from the Debug view. | |
| Terminate All | Kill all active processes in the Debug view. | |
| Disconnect | Detach the debugger (i.e. gdb) from the selected process (useful for debugging attached processes). | |
| Remove All Terminated Launches | Clear all the killed processes from the Debug view. | |
| Restart | Restart the process. |
|
The debugger keeps the project's files open while the program is running. Be sure to terminate the debug session before you try to rebuild the project, or else the build will fail. |
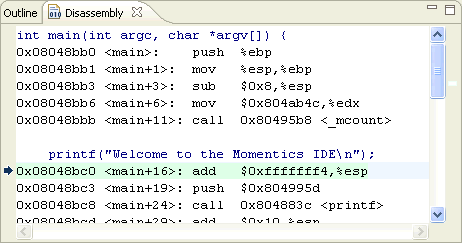
You can also examine your program as it steps into functions that you don't have source code for, such as printf(). Normally, the debugger steps over these functions, even when you click Step Into. When the instruction pointer enters functions for which it doesn't have the source, the IDE shows the function in the Disassembly view.
The workbench adds the Disassembly view to the Debug perspective:
If you click in this view or use the
Toggle Instruction Stepping icon
(![]() )
to give focus to this view, the operators (e.g. Run to Line) operate
on machine instructions instead of the source code.
)
to give focus to this view, the operators (e.g. Run to Line) operate
on machine instructions instead of the source code.
Besides the Debug view, you'll find several other useful views in the Debug perspective:
| To: | Use this view: |
|---|---|
| Inspect variables | Variables |
| Use breakpoints and watchpoints | Breakpoints |
| Evaluate expressions | Expressions |
| Inspect registers | Registers |
| Inspect a process's memory | Memory |
| Inspect shared library usage | Modules |
| Monitor signal handling | Signals |
| View your output | Console |
| Interact with GDB | Console |
The Variables view displays information about the variables in the currently selected stack frame:
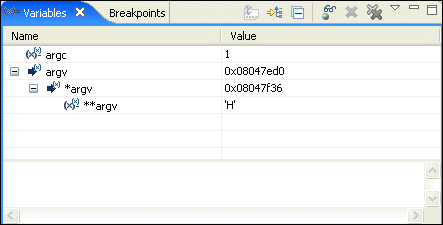
At the bottom of the view, the Detail pane displays the value of the selected variable.
|
If you happen to have multiple variables of the same name, the one most in scope is evaluated. |
When the execution stops, the changed values are highlighted in yellow (by default). Like the other debug-related views, the Variables view doesn't try to keep up with the execution of a running program; it updates the display only when execution stops.
You can decide whether or not to display the variable type (e.g.
int) by clicking the Show Type
Names toggle button (![]() ).
The Show Type Names button is unavailable
when columns are displayed.
).
The Show Type Names button is unavailable
when columns are displayed.
You can also control whether or not the IDE tracks all your program's variables. See the "Debugger tab" section in the Launch Configurations Reference chapter.
|
Tracking all the variables can reduce your program's performance. |
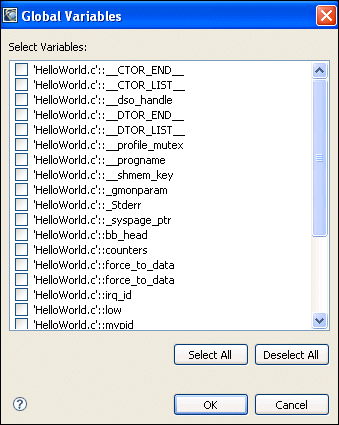
By default, global variables aren't displayed in the Variables view. To add global variables to the view:
While debugging a program, you may wish to manually change the value of a variable to test how your program handles the setting or to speed through a loop.
To change a variable value while debugging:
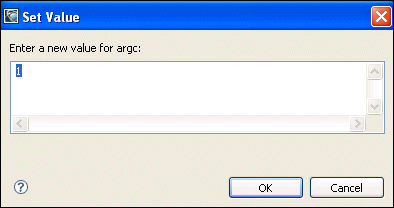
|
You can also change a variable's value in the Detail pane at the bottom of the Variables view. Click the value, change it, and then press Ctrl-S to save the new value. |
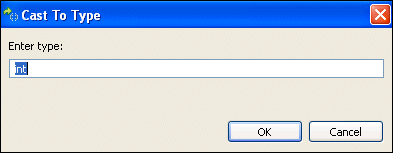
You can prevent the debugger from reading the value of variables from the target. You might use this feature for variables that are either very sensitive or specified as volatile. This can also improve your program's performance.
To change a variable to a different type:
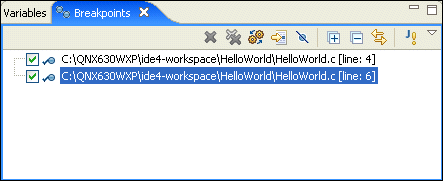
The Breakpoints view lists all the breakpoints and watchpoints you've set in your open projects:
A breakpoint makes your program stop whenever a certain point in the program is reached. For each breakpoint, you can add conditions to better control whether or not your program stops.
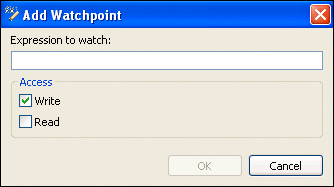
A watchpoint is a special breakpoint that stops the program's execution whenever the value of an expression changes, without specifying where this may happen. Unlike breakpoints, which are line-specific, watchpoints are event-specific and take effect whenever a specified condition is true, regardless of when or where it occurred.
| Object | Icon |
|---|---|
| Breakpoint | |
| Watchpoint (read) | |
| Watchpoint (write) | |
| Watchpoint (read and write) |
|
If the breakpoint or watchpoint is for a connected target, the IDE places a
check mark on the icon.
For example:
|
The rest of this section describes how to:
You set breakpoints on an executable line of a program. When you debug the program, the execution is suspended before that line of code is executed.
To add a breakpoint:
A dot appears, indicating the breakpoint:
A corresponding dot also appears in the Breakpoints view, along with the name of the file in which you set the breakpoint:.
To add a watchpoint:
After you've set your breakpoint or watchpoint, the IDE unconditionally halts the program when:
or:
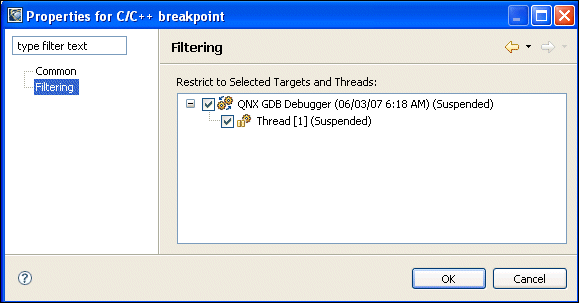
To set the properties for a breakpoint or watchpoint:
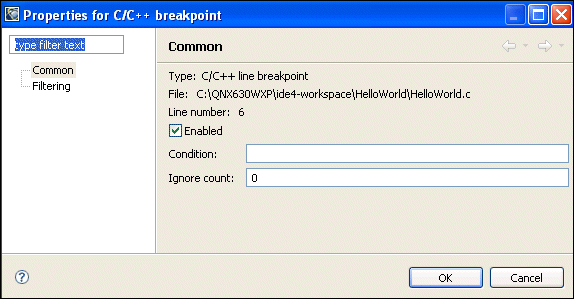
In the Condition field, enter the Boolean expression to evaluate. The expression may be anything that can be evaluated inside an if statement (e.g. x > y ). The default is TRUE.
In the Ignore Count field, enter the number of times the breakpoint or watchpoint may be hit before it begins to take effect (not the number of times the condition is true). The default is 0.
You may wish to temporarily deactivate a breakpoint or watchpoint without losing the information it contains.
For breakpoints only, right-click the breakpoint in the editor area and select Disable Breakpoint or Enable Breakpoint.
To disable or enable multiple breakpoints or watchpoints:
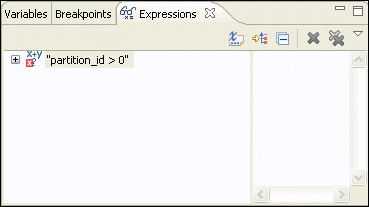
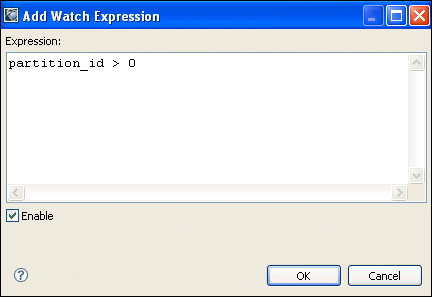
The Expressions view lets you evaluate and examine the value of expressions. To display this view, choose .
|
The Expressions view is similar to the Variables view; for more information, see the "Inspecting variables" section in this chapter. |
To evaluate an expression:
The Registers view displays information about the registers in the currently selected stack frame. When the execution stops, the changed values are highlighted. To display this view, choose .
|
The Registers view is similar to the Variables view; for more information, see the "Inspecting variables" section in this chapter. |
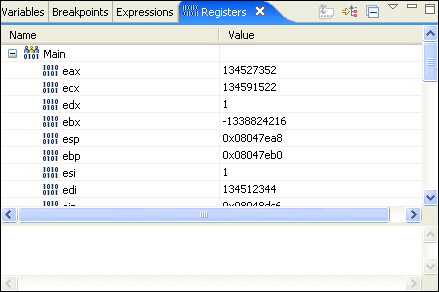
You can also customize the colors in the Registers view and change the default value of the Show Type Names option.
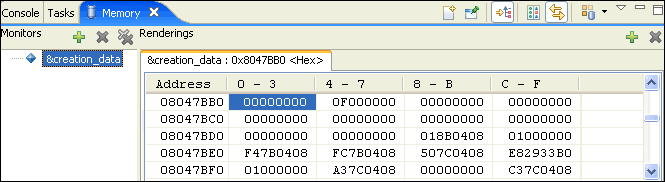
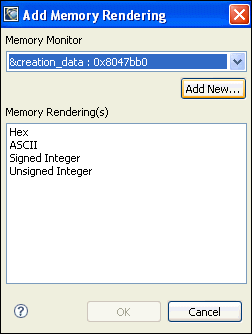
The Memory view lets you inspect and change your process's memory. To display this view, choose . The view is initially empty, but after you've added an item to monitor and specified the output format, this view will look something like this:
|
QNX Neutrino uses a virtual-addressing model wherein each process has its own range of valid virtual addresses. This means that the address you enter into the Memory view must be a virtual address that's valid for the process you're debugging (e.g. the address of any variable). For more on QNX Neutrino's memory management, see the Process Manager chapter in the System Architecture guide. |
The Memory view supports the same addressing as the C language. You can address memory using expressions such as 0x0847d3c, (&y)+1024, and *ptr.
To inspect the memory of a process:
You can display memory in hexadecimal or ASCII, or as signed or unsigned integers:
To change a process's memory:
The changed memory appears in red.
|
Changing a process's memory can make your program crash. |
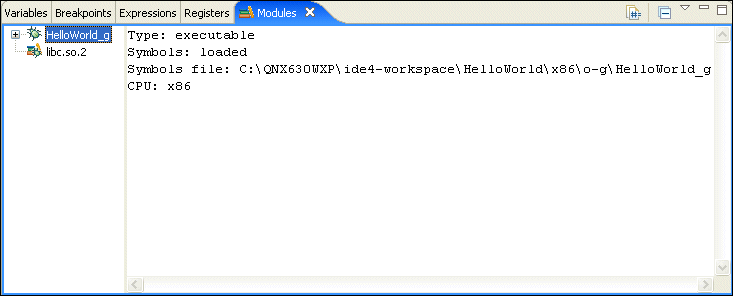
The Modules view shows you information about the shared libraries for the session you select in the Debug view. The view shows the name, base address, and size of each library. To display this view, choose .
The Signals view provides a summary of how your debugger handles signals that are intercepted before they're received by your program. To display this view, choose .
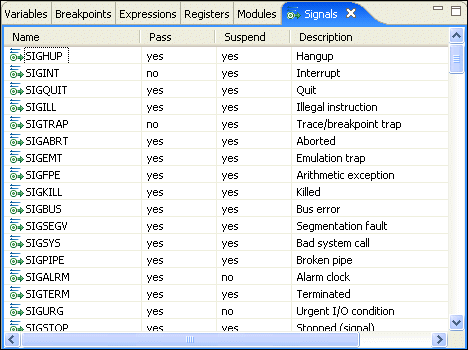
The view contains the following fields:
To change how the debugger handles a signal:
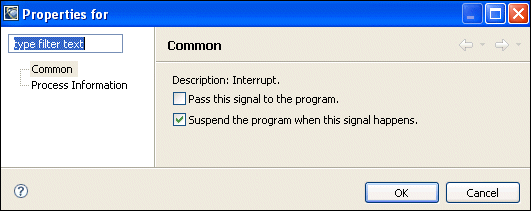
Check Suspend the program when this signal happens to suspend the program when it receives this signal. Uncheck it to let the program handle the signal as it normally would.
To send a signal to a suspended program:
|
You can see a thread-by-thread summary of how your program handles signals using the Signal Information view. To learn more, see the "Mapping process signals" section in the Getting System Information chapter. |
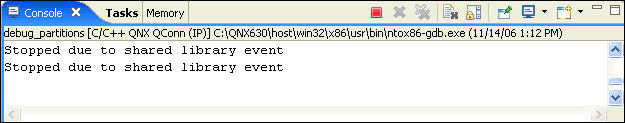
The Console view shows you the output of the execution of your program and lets you supply input to your program:
The console shows three different kinds of text, each in a different default color:
|
If you're connecting to your target via qconn, your process's output all appears in the same color because qconn combines standard output and standard error into one stream. |
You can choose different colors for these kinds of text on the preferences pages.
To access the Console view's customization dialog:
You can have more than one Console view, which is useful if you're working on more than one application at once:
Remember that you can copy data from the console and paste it elsewhere.
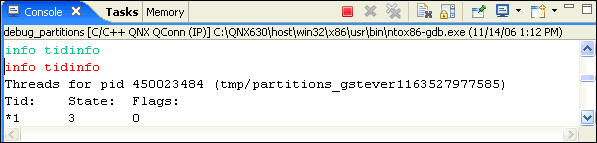
The IDE lets you use a subset of the commands that the gdb utility offers:
To learn more about the gdb utility, see its entry in the Utilities Reference and the Using GDB appendix of the Neutrino Programmer's Guide.
The QNX GDB Console view is part of the regular Console perspective. It appears as soon as the data is sent to it.
To switch to the QNX GDB Console view:
The Console view changes to the QNX GDB Console view.
The QNX GDB Console view lets you bypass the IDE and talk directly to GDB; the IDE is unaware of anything done in the QNX GDB Console view. Items such as breakpoints that you set from the QNX GDB Console view don't appear in the C/C++ editor.
|
You can't use the Tab key for line completion because the commands are sent to GDB only when you press Enter. |
|
To enter commands, you must be on the last line of the Console view. |
|
|
|
|